HPU Poll: Majority of North Carolinians Are Celebrating Halloween This Year
More than 4 out of 5 North Carolina respondents have favorable views of M&M’s, Hershey bars, Kit Kat and Reese’s Cups.
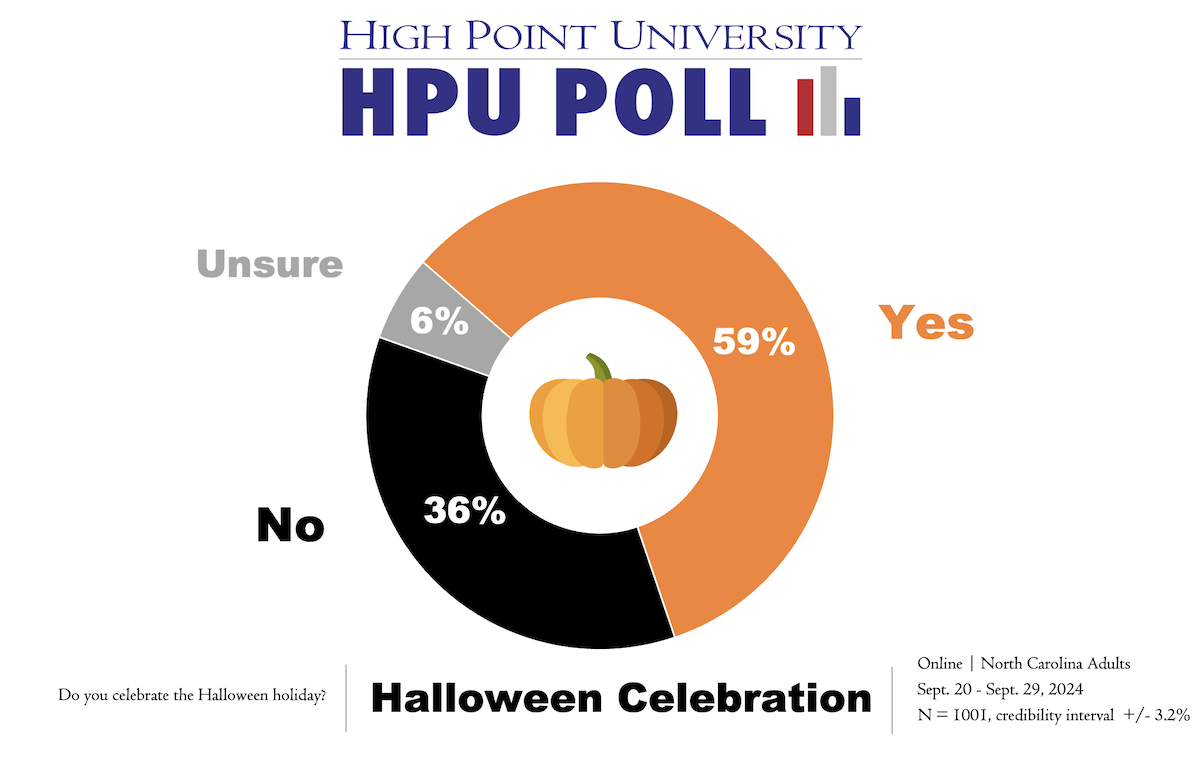
HIGH POINT, N.C., Oct. 29, 2024 – A High Point University Poll finds that a majority (59%) of North Carolinians will celebrate Halloween this year, while 36% will not celebrate. These findings are significantly higher than a 2023 HPU Poll, when only 47% of North Carolinians said they would celebrate Halloween.
Two-thirds (67%) of North Carolinians say they will spend less than $100 celebrating Halloween. Only 4% say they will spend $200 or more.
A majority (60%) of respondents said they will spend the same amount of money for Halloween as last year, while 14% will spend more and 20% will spend less. In 2023, 61% said they will spend the same amount of money for Halloween as the previous year, while 17% they would spend more and 18% would spend less.
This year, we asked North Carolina residents to indicate whether they plan to do a variety of things to celebrate Halloween. Just about half said that they will watch a scary movie (54%), pass out candy to children trick-or-treating at their house (49%), or display Halloween decorations in their home or yard (49%). Less than 45% of respondents said that they will carve a pumpkin (41%), wear a costume (33%), dress their children in costumes (31%), take children trick-or-treating (31%), attend a Halloween party (27%), dress up a pet in costume (23%) or pass out healthy snacks instead of candy to children trick-or-treating (20%).
The poll also asked respondents to indicate whether they have favorable or unfavorable views of several candies. Over three-quarters said that they have a favorable opinion of M&M’s (85%), Hershey bars (85%), Kit Kat (85%), Reese’s Cups (85%), Snickers (84%), and Twix (81%). Still, a majority said that they have a favorable opinion of Butterfinger (72%), Tootsie Rolls (70%), Skittles (66%), Whoppers (62%), Smarties (61%), candy corn (53%), Nerds (54%), pumpkin spice (53%), and Sour Patch Kids (56%). Mary Janes, the candy that is in orange and black wrapping and tastes kind of like peanut butter, only had a favorable rating of 46% among North Carolinians.
“According to our most recent poll, more than half of North Carolinians will be celebrating Halloween this year, which is more than last year,” said Natalie Hinson, research assistant for the HPU Poll. “It overall seems as though the holiday spirit is a little higher for North Carolinians this year versus the previous year as well with more people celebrating in various ways. People’s favorite candies this year are also remarkably similar to the previous few years, with the top five most popular being M&M’s, Hershey Bars, Kit Kats, Reese’s Cups and Snickers.”
North Carolina Residents – Halloween (October 2024)
It’s a few weeks away, but do you celebrate the Halloween holiday?
Yes – 59%
No – 36%
Unsure – 6%
Some people spend a lot of time and money celebrating the Halloween holiday. Others do not celebrate much at all. Altogether, how much money would you say you will spend this year on Halloween, including things like costumes, decorations, candy to give out and food and drinks?
Less than $100 – 67%
More than $100 but less than $200 – 19%
$200 or more – 4%
Unsure – 10%
Would you say that is more or less than last year?
More – 14%
About the same – 60%
Less – 20%
Unsure – 7%
Please indicate whether you plan to do each of the following to celebrate Halloween, or not? [Items presented in a random order]
| Yes | No | Unsure | |
| Watch a scary movie | 54 | 39 | 7 |
| Pass out candy to children trick-or-treating at your house | 49 | 43 | 8 |
| Display Halloween decorations in your home or yard | 49 | 46 | 6 |
| Carve a pumpkin | 41 | 50 | 9 |
| Wear a costume | 33 | 58 | 9 |
| Dress your children in costumes | 31 | 63 | 6 |
| Take children trick-or-treating | 31 | 64 | 6 |
| Attend a Halloween party | 27 | 63 | 10 |
| Dress up a pet in costume | 23 | 72 | 5 |
| Pass out healthy snacks instead of candy to children trick- or-treating at your house | 20 | 71 | 9 |
Please indicate whether you have [a favorable or an unfavorable] view of each of items listed below. [Items presented in a random order]
| Favorable | Unfavorable | Unsure/Not familiar with this person or thing | |
| M&M’s | 85 | 11 | 4 |
| Hershey bars | 85 | 12 | 3 |
| Kit Kat | 85 | 12 | 4 |
| Reese’s Cups | 85 | 12 | 3 |
| Snickers | 84 | 13 | 3 |
| Twix | 81 | 15 | 3 |
| Butterfinger | 72 | 23 | 5 |
| Tootsie rolls | 70 | 26 | 5 |
| Skittles | 66 | 29 | 5 |
| Whoppers | 62 | 31 | 7 |
| Smarties | 61 | 30 | 9 |
| Candy corn | 53 | 42 | 5 |
| Nerds | 54 | 38 | 8 |
| Pumpkin spice | 53 | 39 | 7 |
| Sour Patch Kids | 56 | 38 | 6 |
| Mary Janes (that candy that is in orange and black wrapping and tastes kind of like peanut butter) | 46 | 38 | 16 |
HPU Poll 106 was fielded by the High Point University Survey Research Center on Sept. 20 through Sept. 29, as an online survey using a panel of respondents recruited and maintained by Dynata. Dynata sent invitations to its panel of North Carolina respondents and the SRC collected 1,001 responses (an all-adults sample) on its Qualtrics platform. All respondents were asked two screening questions to identify them as registered voters. A total of 814 respondents identified themselves as registered voters. The SRC did all data analysis. The online sample is from a panel of respondents, and their participation does not adhere to usual assumptions associated with random selection. Therefore, it is not appropriate to assign a classic margin of sampling error for the results. In this case, for the all-adults sample, the SRC provides a credibility interval of plus or minus 3.2 percentage points to account for a traditional 95% confidence interval for the estimates (plus or minus 3.1 percentage points) and a design effect of 1.1 (based on the weighting). For the registered voters, the SRC provides a credibility interval of plus or minus 3.6 percentage points to account for a traditional 95% confidence interval for the estimates (plus or minus 3.4 percentage points) and a design effect of 1.1 (based on the weighting). The all-adults data is weighted toward population estimates for age, gender, race, ethnicity, and education based on U.S. Census numbers for North Carolina. The sample was also weighted using a past presidential vote questionnaire item and the North Carolina 2020 presidential election results (North Carolina State Board of Elections https://www.ncsbe.gov/). The High Point University Survey Research Center (SRC) produces weights through an iterative procedure within SPSS. Factors such as question wording and other methodological choices in conducting survey research can introduce additional errors into the findings of opinion polls.
Further results and methodological details from the most recent survey and past surveys can be found at the Survey Research Center website. Materials online include past press releases as well as memos summarizing the findings (including approval ratings) for each poll since 2010.
The HPU Poll reports methodological details in accordance with the standards set out by AAPOR’s Transparency Initiative and the HPU Survey Research Center is a Charter Member of the Initiative.
You can follow the HPU Poll on LinkedIn
Dr. Martin Kifer, chair and professor of political science, serves as the director of the HPU Poll.
Natalie Hinson is a research assistant for the HPU Survey Research Center.